 Metereocycle
procedural data visualisation
Linear data representations are more common
than polar graphs, for good reasons. It's way
easier to compare the deltas of outliers and see
trends unfold. Because were from left to right
(in some languages from right to left) a
cartesian representation of values is more
intuitive while a polar representation requires
the onlooker to make an additional step of
mental decoding.
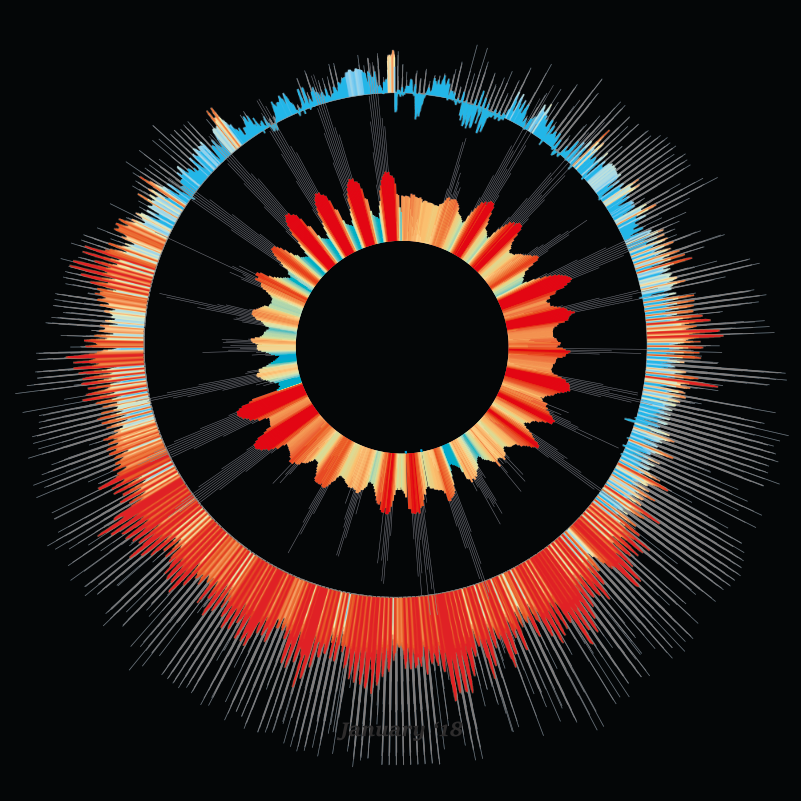
However a dataset, that descibes natural cyclic
activity, a polar representation might grant the
onlooker with new perspective and a new
mental model. One such example is
meterological data visualised in one-year
intervals. A year is a cyclic process made up of
recurring sub-cyles.
Days and months (in a lunisolar calendar
system). The gregorian calendar is a solar
calendar: it lines up the dates and seasons to the
earths position relative to the sun. However the
gregorian calendar is not lunisolar, as it doesn't
take the moon cyvcles into account. Because a
purely lunar calendar quickly drifts against the
seasons, in lunisolar calendars (for example the
Hebrew or Chinese calendar), an additional
month is added every few years in order to
mitigate the seasonal shift)
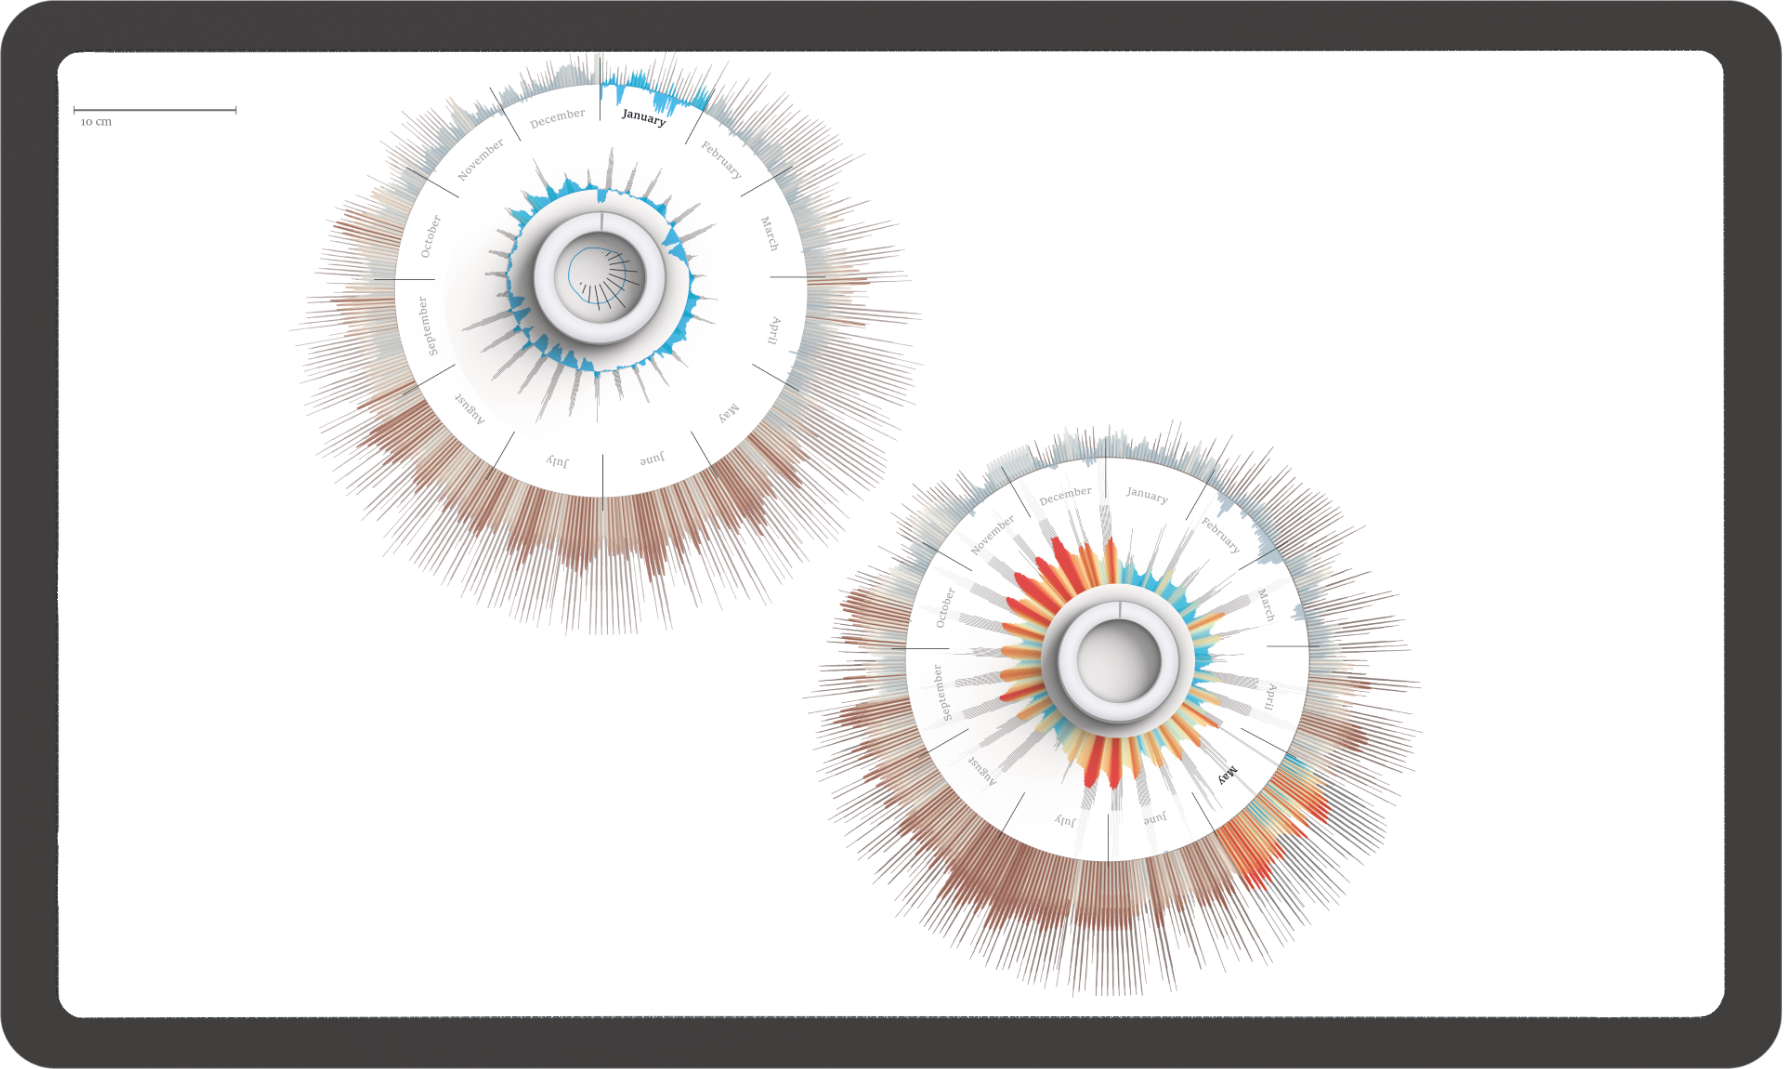
In this project a visualisation was created that
emphasises on the cyclic nature of movement in
the universe and create an alternative mental
modeloftime. Also every year,month and day is
different and leaves it's unique mark like age
rings in a tree.
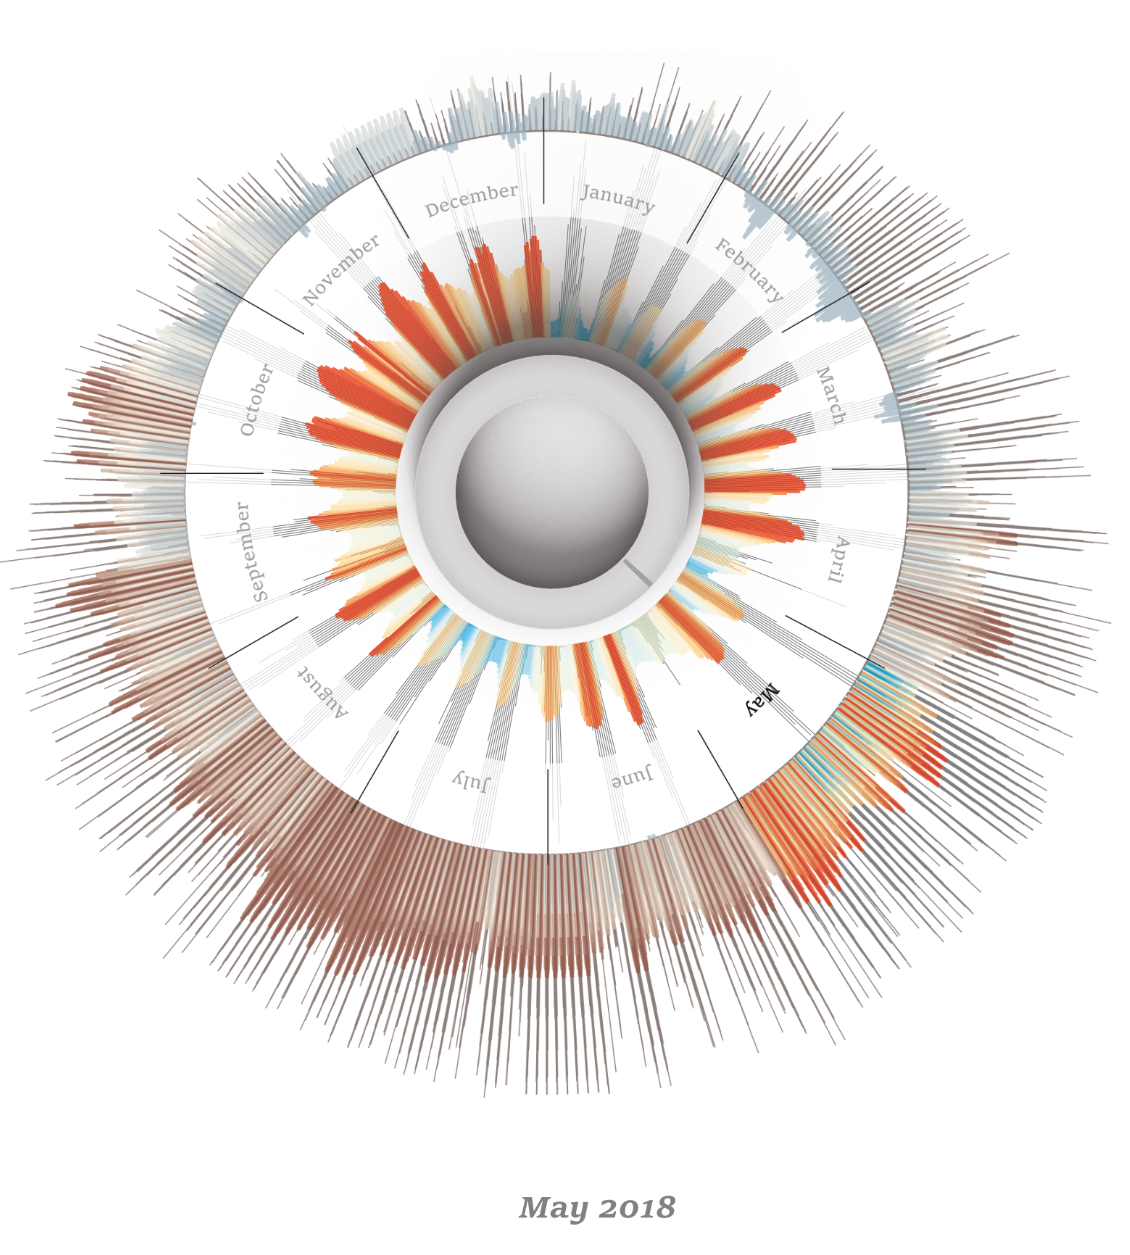
The resulting visualisations show temperature
and global radiation (intensity of sun rays
hitting the earth's surface at the measuring
station). The data was provided by the solar
institute in J³lich and visualised.